Calculating the Score
Most charts score from 0-3, according to the degree of deviation away from 'normal range'.
A total score is then calculated.
Question: Now what should you do?

Most charts score from 0-3, according to the degree of deviation away from 'normal range'.
A total score is then calculated.
Question: Now what should you do?
Answer: When the total score has been calculated, various actions are triggered, for example:
- Low score, e.g. <3: Continue monitoring
- High score, e.g. 3 or more: Intervention is required
Fig 1 shows an example of a triggered flow chart.
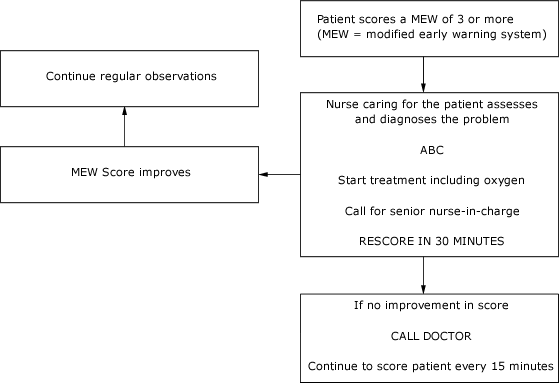
Fig 1 Modified early warning system (MEW)