Table of Values
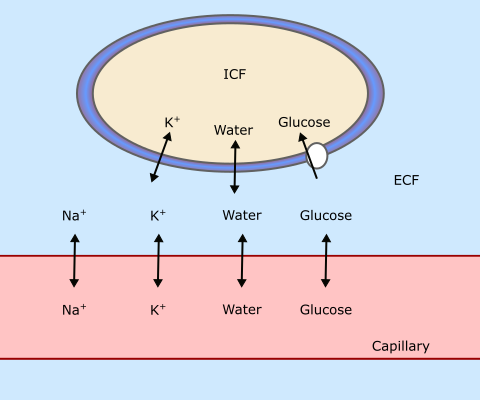
Fig 1 shows how fluid is exchanged between the extracellular fluid (ECF) and intracellular fluid (ICF).
The values for the volumes and composition of cellular fluids are as follows:


|
Daily requirement |
|
|---|---|
|
Water |
2.5-3 litres |
|
Na+ |
140-160 mmol |
|
K+ |
80-100 mmol |
Table 1 Daily requirements, normal adult
|
ECF |
ICF |
|
|---|---|---|
|
Na+ |
145 |
12 |
|
K+ |
5 |
150 |
|
Ca2+ |
2.5 |
0.001 |
|
Cl- |
105 |
5 |
|
HCO3- |
25 |
12 |
|
pH |
7.4 |
7.1 |
Table 2 Composition of body fluids
|
Stomach (low secretion rate) |
Stomach (high secretion rate) |
Small bowel |
|
|---|---|---|---|
|
Na+ |
90 mmol/L |
10 mmol/L |
130 mmol/L |
|
K+ |
10 mmol/L |
20 mmol/L |
5 mmol/L |
|
Cl- |
125 mmol/L |
155 mmol/L |
110 mmol/L |
|
HCO3- |
- |
- |
30 mmol/L |
|
H+ |
20 mmol/L |
125 mmol/L |
30 mmol/L |
|
Daily volume produced |
2 litres |
2 litres |
1.5 litres |
Table 3 Composition of stomach and small bowel secreations
Ionic composition depends on rate of gastric secretion; sodium production falls and hydrogen ion secretion rises greatly on increasing secretion rate from 0.5-2.5 ml/min.